Alpha Edge Pro Academy
AlphaEdge Pro Academy · Student guide

APA Theory
Advanced Price Action

Use the weekly close to understand direction. Then watch intraday Momentum levels for a potential setup.

Explore the theory ↓
APA visual classroom

APA + Momentum at a glance

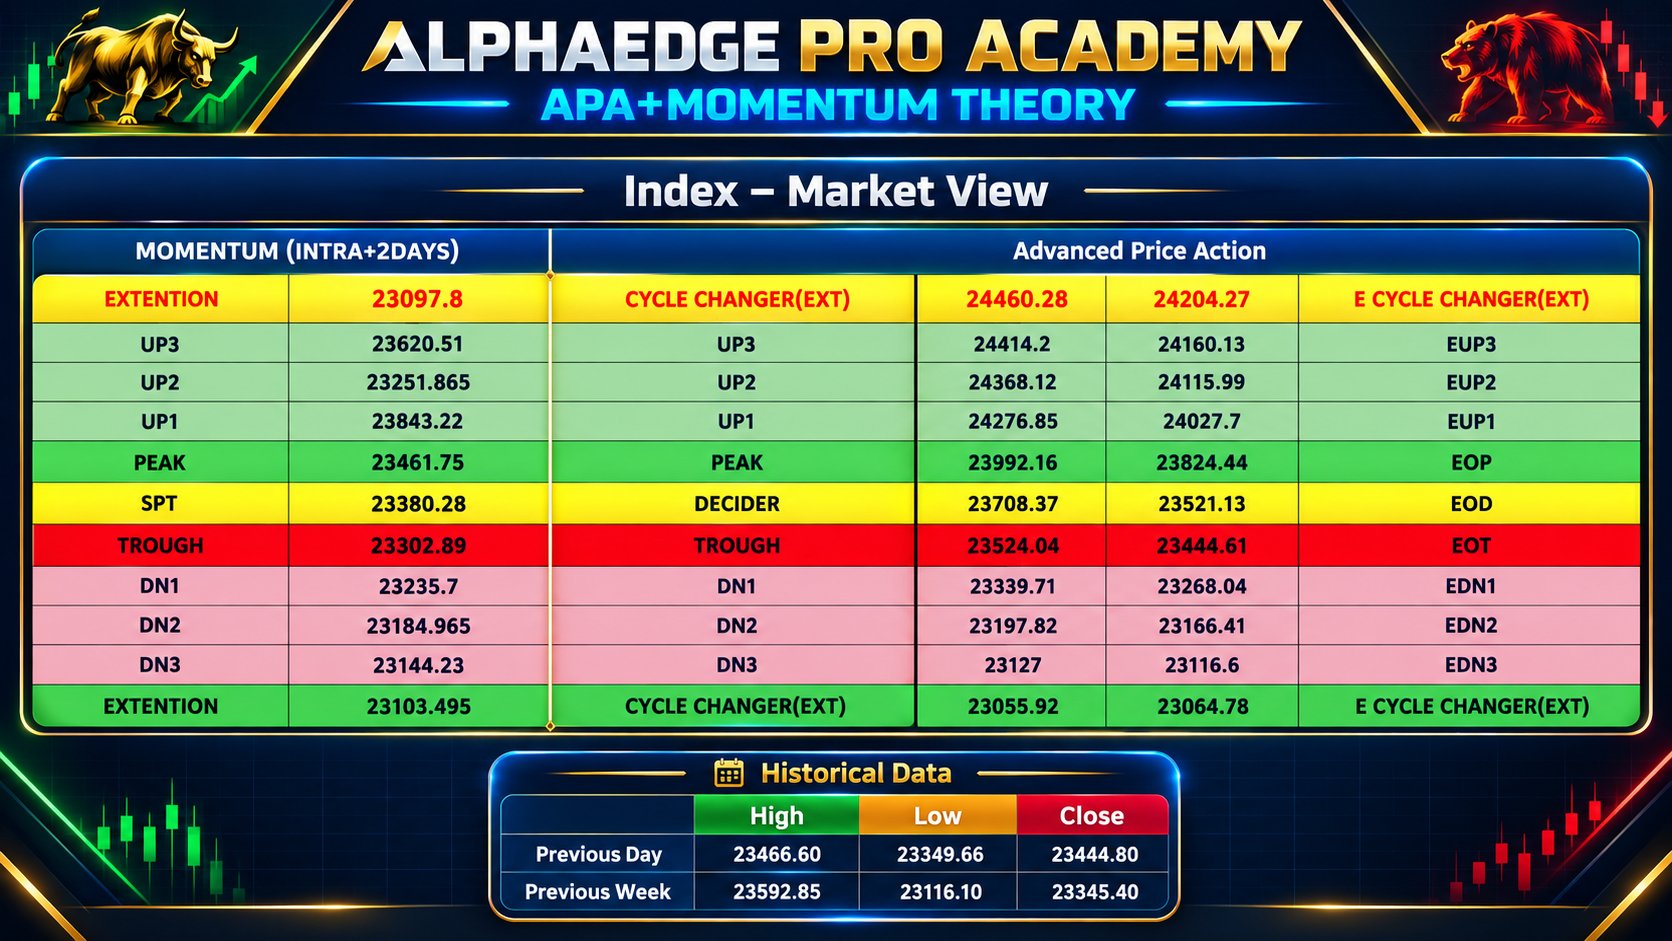
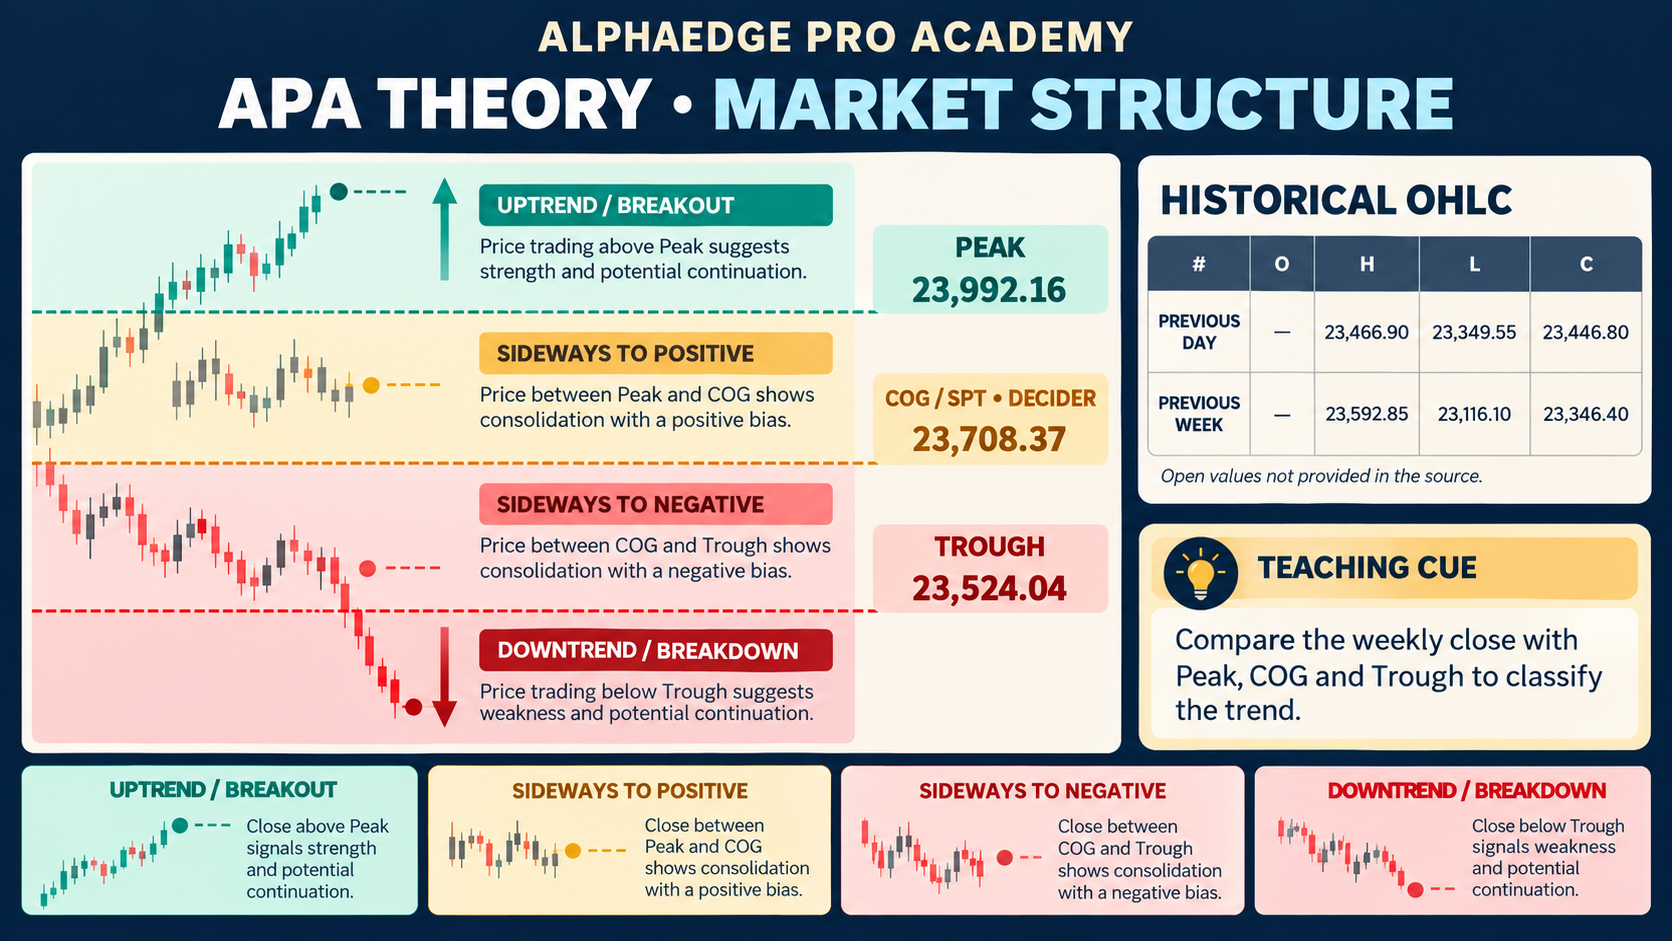
Study the combined level sheet first. The market structure image below explains how the weekly close is classified.

AlphaEdge APA and Momentum index market view with intraday levels, APA levels, and previous day and previous week high, low and close
01 · APA + Momentum levelsIndex market view and historical data
AlphaEdge APA market structure teaching chart: Peak, COG/SPT and Trough; four weekly close classifications with previous day and previous week OHLC
02 · APA market structureWeekly trend zones and historical OHLC
The framework

Two views of the same stock

APA sets the short-term direction from the weekly close. Momentum helps you watch for an intraday trigger. The weekly view comes first; the intraday setup follows.

01 · WEEKLY

APA: trend classification

Classify a stock or index using its weekly close relative to APA Peak, SPT (COG) and Trough.

02 · INTRADAY

Momentum: entry watch

Watch the separate intraday Momentum levels for a radar zone and a trigger.

Reference points

APA and Momentum: two separate level maps

APA uses the Friday weekly close to set the short-term context. Momentum supplies separate intraday alert and activation levels. Always check which system a label belongs to.

In the bullish example, Momentum Peak must be above APA Peak. The two level maps have separate calculated values and are conceptual, not drawn to a shared price scale.
Weekly close

Classify the trend first

Compare the weekly closing price with APA's three levels. This tells you which side of the market to study.

Close above PeakUPTRENDBreakout-side classification
Peak to COGSIDEWAYS TO POSITIVEBetween upper and central levels
COG to TroughSIDEWAYS TO NEGATIVEBetween central and lower levels
Close below TroughDOWNTRENDBreakdown-side classification
The classification uses the weekly closing price, not a temporary intraday move.
The next move

What APA asks you to observe

WEEKLY CLOSE ABOVE PEAK

Does COG act as support?

After a bullish classification, watch whether price holds near COG on a pullback.

WEEKLY CLOSE BELOW TROUGH

Does COG reject price?

After a bearish classification, watch whether price is rejected near COG on an upward move.

These are patterns to observe. Any level can fail.
APA teaching scenario 01

A breakout is decided by the close

A brief move beyond Peak or Trough can fail. In this scenario, compare the candle’s extreme with its close before considering the next levels.

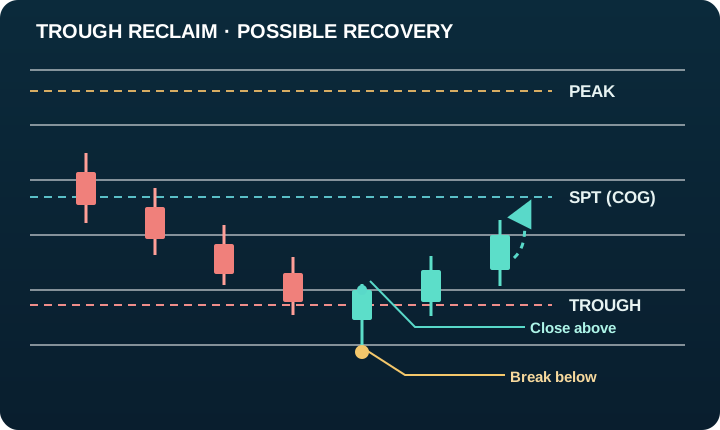
Teaching diagram: a candle breaks below Trough but closes back above it; SPT and Peak are possible recovery levels
TROUGH · BREAK AND RECLAIM

Break below, close above

Price moves below the APA Trough during the candle, but closes back above it. This failed breakdown can create a possible recovery toward SPT (COG), and then Peak.

What to watch: the close above Trough and whether subsequent candles hold that boundary. SPT and Peak are potential observation levels, not promised targets.
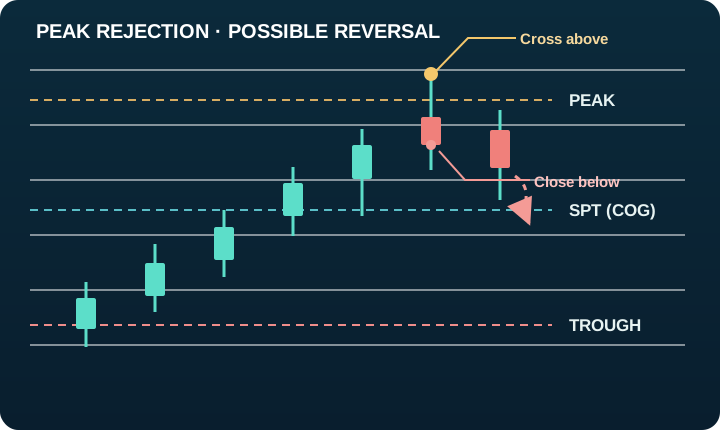
Teaching diagram: a candle crosses above Peak but closes back below it; SPT and Trough are possible downside levels
PEAK · CROSS AND REJECT

Cross above, close below

Price crosses the APA Peak during the candle, but fails to close above it. This failed breakout can create a possible reversal toward SPT (COG), and then Trough.

What to watch: the close below Peak and whether subsequent candles remain beneath that boundary. SPT and Trough are potential observation levels, not promised targets.
Keep the setup focused on Peak and Trough.

Use these outer boundaries to identify a failed break with a clearly defined risk point. Treat SPT as an intermediate level to observe, rather than a new entry signal. Wait for the relevant close and set a risk limit before any trade; a failed break may resume in its original direction.

APA teaching scenario 02

Weekly direction, intraday alert, APA trigger

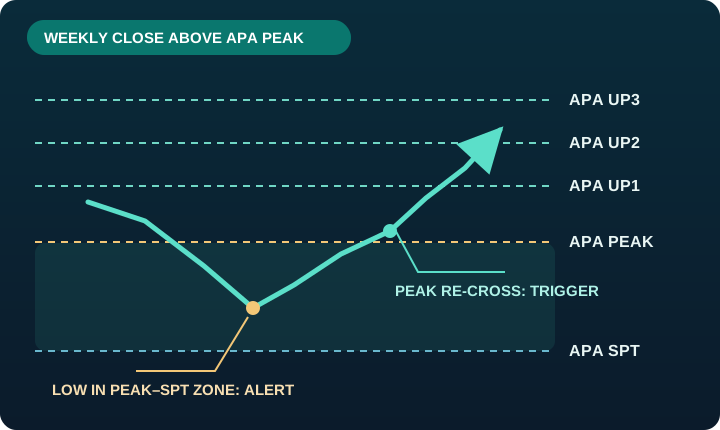
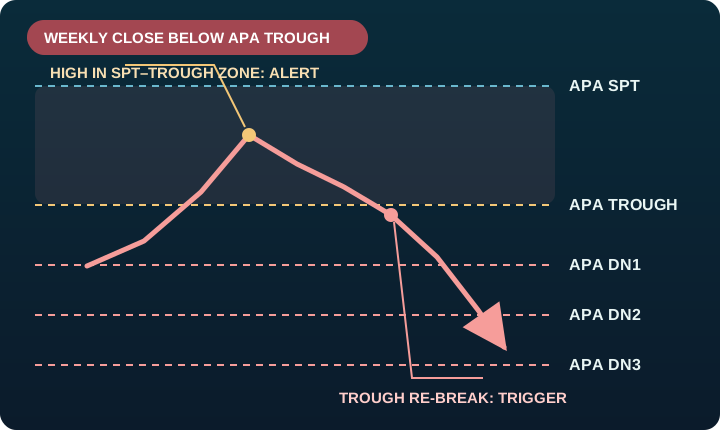
First confirm the weekly APA classification. Then watch where the intraday low or high forms relative to the APA boundaries. The boundary cross is the trigger; the numbered APA levels become the next levels to observe.

Bullish APA Scenario 2: weekly close above APA Peak; intraday low between APA Peak and SPT creates alert; recross above APA Peak opens APA UP1, UP2 and UP3
BULLISH · PEAK RE-CROSS

From the alert zone to APA UP1–UP3

  1. Weekly direction: The stock closes above APA Peak.
  2. Intraday alert: Its low forms between APA Peak and APA SPT (COG).
  3. Upside trigger: Price moves back above APA Peak.
  4. Levels to watch: APA UP1, then UP2, then UP3.

Peak is the decision boundary. The three upside levels are potential targets, not guaranteed moves.

Bearish APA Scenario 2: weekly close below APA Trough; intraday high between APA Trough and SPT creates alert; move below APA Trough opens APA DN1, DN2 and DN3
BEARISH · TROUGH RE-BREAK

From the alert zone to APA DN1–DN3

  1. Weekly direction: The stock closes below APA Trough.
  2. Intraday alert: Its high forms between APA Trough and APA SPT (COG).
  3. Downside trigger: Price moves back below APA Trough.
  4. Levels to watch: APA DN1, then DN2, then DN3.

Trough is the decision boundary. The three downside levels are potential targets, not guaranteed moves.

Keep the order clear: weekly classification → intraday alert → APA boundary trigger → APA targets.

The intraday low or high is an alert, not the entry by itself. Define the invalidation and risk before acting. These diagrams are conceptual and contain no live market levels.

APA teaching scenario 03

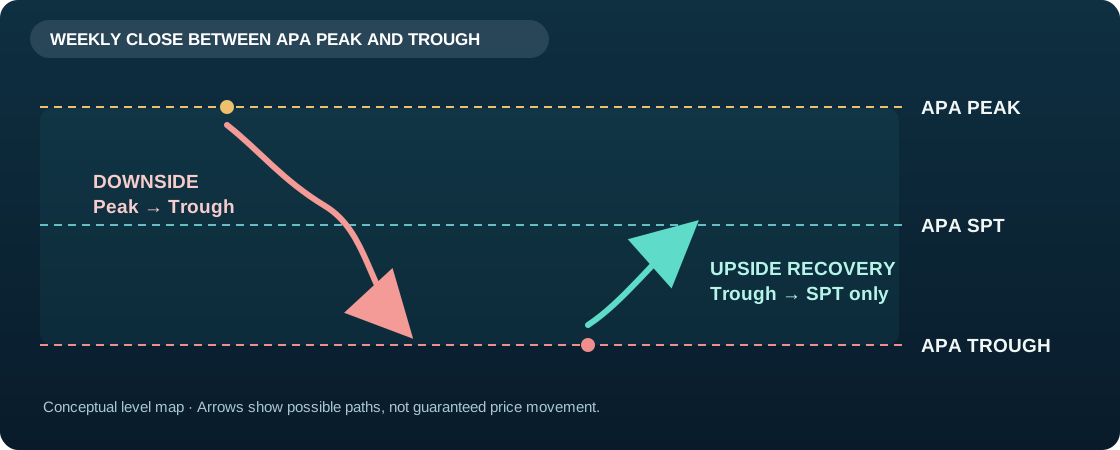
Weekly close inside the APA range

When the weekly close is between APA Peak and APA Trough, treat the stock as being inside the range. Keep the next observation limited to the levels below.

APA range map: weekly close between Peak and Trough; potential downside path from Peak toward Trough; potential upside recovery from Trough only toward SPT
Conceptual APA range map. The arrows show levels to observe, not guaranteed moves.
DOWNSIDE · OUTER BOUNDARIES

Peak → Trough

For the downside, focus on APA Peak and APA Trough. Watch for weakness near the upper boundary and use Trough as the lower level to observe.

UPSIDE · TROUGH RECOVERY

Trough → SPT (COG)

For the upside, watch a recovery from APA Trough toward APA SPT. In this scenario, SPT is the recovery level to observe.

Scenario 3 level plan: Peak and Trough for the downside; Trough to SPT for the upside. Wait for price behavior at the boundary and define risk before acting.
APA teaching scenario 04

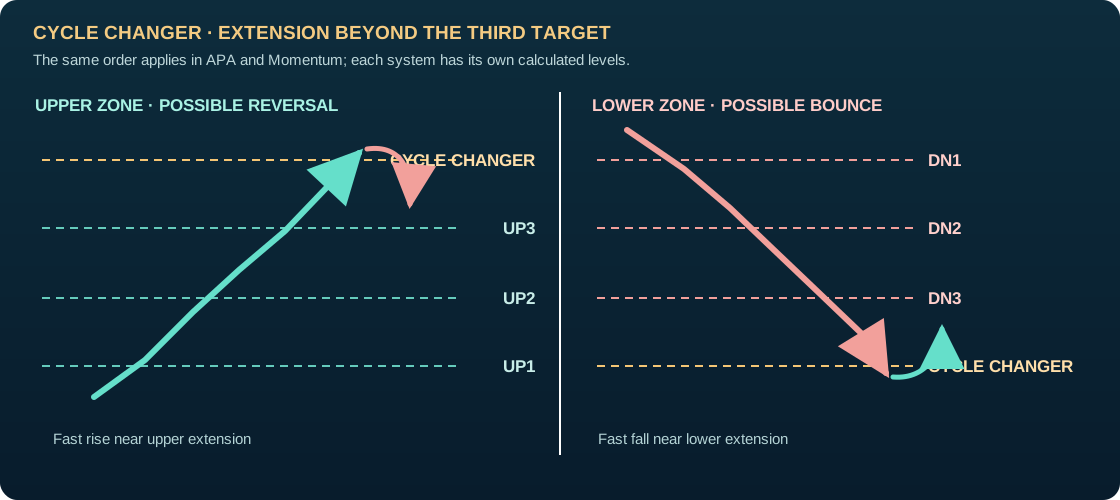
Cycle Changer sits beyond target 3

Both APA and Momentum have Cycle Changer levels. In each system, the upper Cycle Changer is above UP3 and the lower Cycle Changer is below DN3. These are extension areas where a fast move can occur and a reaction may follow.

Two-panel level ladder for APA and Momentum: upper Cycle Changer above UP3 with possible reversal after a fast rise; lower Cycle Changer below DN3 with possible bounce after a fast fall
Conceptual level order for either system. APA and Momentum levels have their own values.
UPPER EXTENSION

UP3 → Cycle Changer

After UP3, watch the upper Cycle Changer area. A fast upward move into that area can be followed by a possible reversal.

LOWER EXTENSION

DN3 → Cycle Changer

Below DN3, watch the lower Cycle Changer area. A fast downward move into that area can be followed by a possible bounce.

READ BOTH SYSTEMS

APA and Momentum

Each has its own UP3, DN3 and Cycle Changer levels. Identify which system's level you are reading before judging the move.

Teaching cue: Fast movement near Cycle Changer does not guarantee a reversal or bounce. Observe the price reaction and define your risk before considering a trade.
APA + Momentum · combined setup

Friday's APA close → intraday Momentum alert → activation

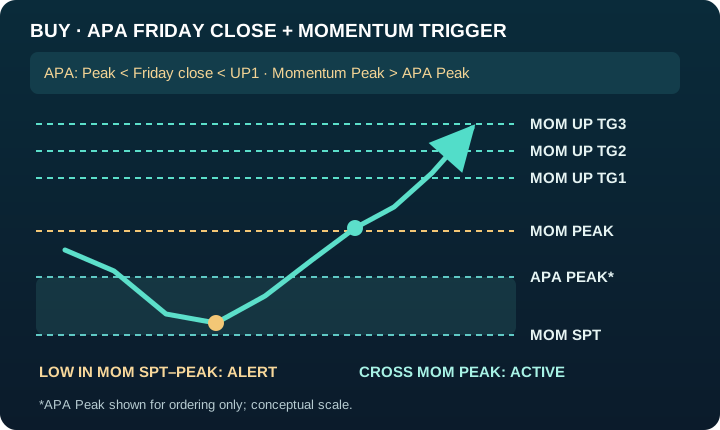
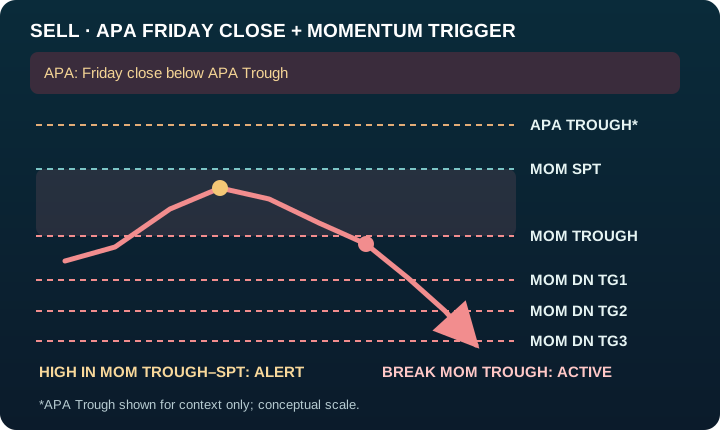
The alert prepares you to watch; the move across the Momentum boundary activates the setup. These are separate events.

Buy setup: Friday close above APA Peak but below APA UP1; Momentum Peak above APA Peak; intraday low between Momentum SPT and Peak gives alert; crossing Momentum Peak activates buy for Momentum UP1, UP2 and UP3
BUY · WEEKLY BIAS + INTRADAY TRIGGER

Momentum upside targets 1–3

  1. Friday close: Above APA Peak and below APA UP1 (short-term bullish context).
  2. Level alignment: Momentum Peak is above APA Peak.
  3. Intraday alert: Stock or index makes a low between Momentum SPT and Momentum Peak.
  4. Buy activation: Price crosses above Momentum Peak. Then watch Momentum upside TG1, TG2 and TG3.
Sell setup: Friday weekly close below APA Trough; intraday high between Momentum Trough and SPT gives alert; crossing below Momentum Trough activates sell for Momentum downside targets 1, 2 and 3
SELL · WEEKLY BIAS + INTRADAY TRIGGER

Momentum downside targets 1–3

  1. Friday close: Below APA Trough (short-term bearish context).
  2. Intraday alert: Stock or index makes a high between Momentum Trough and Momentum SPT.
  3. Sell activation: Price crosses below Momentum Trough. Then watch Momentum downside TG1, TG2 and TG3.
Alert ≠ entry.

The low or high in the Momentum band generates the alert. Crossing Momentum Peak or Trough is the activation. TG1–TG3 are observation levels, not guaranteed results. Define invalidation and risk before trading.

Worked example · illustrative

Stock ABC

Follow the weekly filter before the intraday trigger. ABC is a hypothetical stock, not a live recommendation.

  1. Friday APA: ABC closes above APA Peak and below APA UP1.
  2. Alignment: Momentum Peak is above APA Peak.
  3. Intraday alert: ABC's low reaches the band between Momentum SPT and Peak.
  4. Activation: ABC crosses Momentum Peak. Watch Momentum upside TG1, TG2 and TG3.

CONCEPTUAL MOMENTUM LEVEL VIEW

TG3TG2TG1PEAKSPT
Momentum levels only. Illustration has no prices or returns.
Weekly APA tells you which direction to study. Intraday Momentum tells you when to watch the setup.Observe first. Follow a defined risk plan before trading.