
The Mechanics of Volatility Compression
In retail trading, people chase stocks after they have already moved 8%. Blaster Theory does the exact opposite: we hunt for the "coiled spring" when price is dead silent and volatility is at its 6-month historical low.
Bollinger inside Keltner
A true Squeeze occurs when Bollinger Bands (20 period, 2 standard deviations) contract so tightly that they trade completely INSIDE the Keltner Channels (20 period, 1.5 ATR). This mathematical condition signals that market participants are in complete agreement, and a violent disagreement is imminent.
Energy Storage Dynamics
During the squeeze, open interest (OI) in the Indian derivatives contract builds up while daily traded volume dries up. The longer a stock remains in this squeeze state (e.g. 8 to 15 trading sessions), the more violent the subsequent breakout will be.
Momentum Histogram Shift
The squeeze does not predict direction by itself; it predicts the *magnitude* of the upcoming move. The direction is confirmed when the momentum oscillator prints its first high-volume color shift (e.g. crossing above zero with expanding green histogram bars).
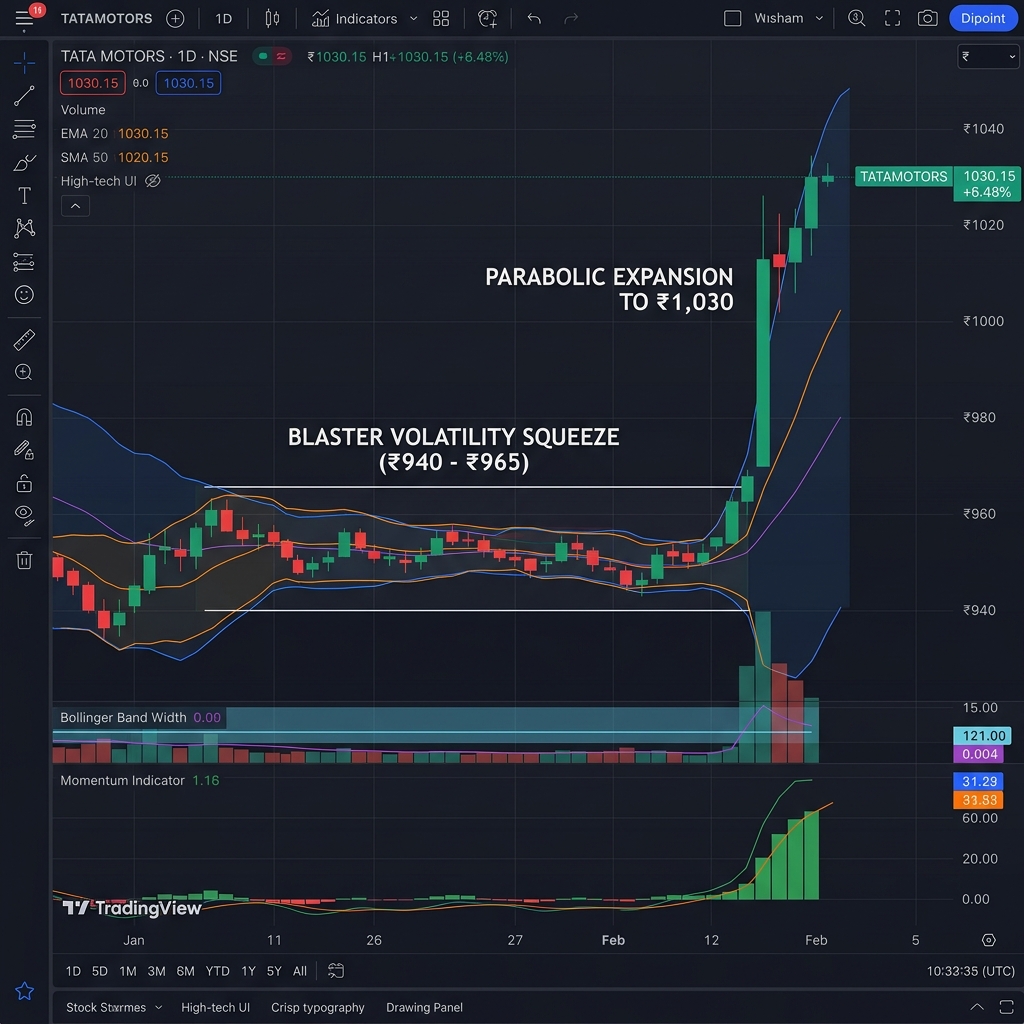
TATA MOTORS: Blaster Volatility Squeeze & Parabolic Breakout
Official trading chart demonstrating the 12-session compression coiling zone between ₹940 and ₹965, followed by the explosive parabolic expansion rally to ₹1,030 on the National Stock Exchange of India (NSE).
The 4 Stages of the Blaster Expansion Engine
Every major trend in Indian stocks—from large-cap bluechips to MCX commodity swings—follows the systematic 4-stage lifecycle of Blaster Theory.
The Coiling Zone
Price consolidates tightly. Bollinger Bands narrow inside Keltner. Daily volume drops 40% below 20-day SMA. Range traders get chopped up, while smart money accumulates inventory quietly.
The Ignition Bar
Bollinger Bands expand outward, breaking outside the Keltner Channels. A high-momentum expansion candle closes above the Upper Band with volume surge. The Squeeze indicator fires "Green".
The Band Walk
Price goes parabolic, "walking up" the upper band for 4 to 8 consecutive sessions. Pullbacks are shallow and respect the 8 EMA. Traders ride the trend without premature profit-taking.
The Climax Exit
The momentum histogram prints its first lower bar or dark green fade. Price prints a divergence candle away from the upper band. Full profits are booked or trailing stop is tightened to the 8 EMA.
The Blaster Mathematical Execution Formula
- Condition 1: Upper Bollinger Band < Upper Keltner Channel AND Lower Bollinger Band > Lower Keltner Channel (Squeeze ON).
- Condition 2: Upper Bollinger Band crosses ABOVE Upper Keltner Channel (Squeeze Fired).
- Condition 3: 1-Day candle close strictly above Upper Band with volume exceeding 1.5× 20-day SMA.
- Invalidation / Stop-Loss: Placed precisely at the 20-period Exponential Moving Average (EMA) or opposite Keltner boundary.
Sectoral Rotation Energy Scans in Indian Markets
Individual stocks rarely blast off in isolation. In the Indian market ecosystem, smart money rotates capital between NSE sectoral indices: Nifty Auto, Nifty Metal, Nifty Energy, Nifty Bank, and Nifty Pharma.
Scanning the Sector First
Before entering any stock, run the Blaster Squeeze scan across the 11 NSE sectoral indices. If NIFTY AUTO is in a Daily Squeeze while Nifty 50 is choppy, the auto sector is storing energy. When NIFTY AUTO fires, auto stocks like Tata Motors, Mahindra & Mahindra, and Bajaj Auto offer 3× higher alpha.
MCX Crude Oil & Natural Gas Energy
Commodities like MCX Crude Oil (1 Lot = 100 barrels) are pure momentum instruments. When MCX Crude coils between ₹6,150 and ₹6,220 for 3 days, the breakout frequently moves ₹250 to ₹400 in 48 hours. A ₹300 move on 1 lot of Crude Oil generates ₹30,000 profit against a ₹12,000 risk.
TATA MOTORS: Live Trade Blueprint with ₹ Values
Detailed operational walkthrough of an authentic Blaster Squeeze swing trade executed on the National Stock Exchange of India.
Live Swing Execution: TATA MOTORS (NSE: TATAMOTORS)
12 Sessions of Coiling
TATA MOTORS consolidates tightly between ₹940.00 and ₹965.00 for 12 days. Daily volume falls to 5.2M shares (average 11M). The Bollinger Bands move entirely inside the Keltner Channels.
Squeeze Fires Green
On Day 13, TATA MOTORS breaks out with heavy institutional delivery volume (19.4M shares). Daily candle closes firmly at ₹978.50. Momentum indicator flips bright green.
Capital & Risk Allocation
Buy entry at ₹980.00. Stop-loss placed at ₹955.00 (just below the 20 EMA). Risk per share: ₹25.00. For a ₹50,000 portfolio risk, position size = 2,000 shares.
The Initial Impulse
Over the next 3 sessions, TATA MOTORS walks up the upper band, surging to ₹1,005.00 (+₹25 gain). Book 50% profits (₹25,000 realized gain). Move stop-loss on remaining shares to cost (₹980.00).
Parabolic High Reached
The runner moves to ₹1,030.00 on Day 18 (+₹50 gain). The daily momentum histogram prints its first darker bar, signaling exhaustion. Full exit executed at ₹1,028.00.
Total Profit: ₹73,000
A systematic ₹25-per-share risk yielded a 1:2.9 risk-to-reward ratio in just 6 trading sessions. The Blaster Squeeze eliminated boredom and captured the exact explosive phase of the trend.
The Golden Rule of Blaster Theory
Never chase a stock that is already expanded 3 ATRs away from its 20 EMA. Wait for the squeeze, verify the volume ignition, and let the explosive expansion come to you.
Return to Academy Dashboard →