
The Science of Relative Strength in Indian Stocks
In academic finance and institutional quant desks, Relative Strength (not to be confused with the RSI oscillator) is the single most persistent market anomaly. Stocks that are outperforming the benchmark index over the trailing 3 to 12 months continue to outperform with 72%+ statistical probability.
Price Ratio Line
We calculate the daily relative ratio: Ratio = Stock Close / NIFTY 50 Close. When this ratio line is sloping upwards, the stock is actively attracting institutional money faster than the benchmark index, regardless of whether the index is up or down.
The "Best House" Rule
When NIFTY 50 drops 300 points, weak stocks crash 5% to 8%. However, true Delta leaders fall only 0.5% or actually close green! This resilience reveals hidden institutional accumulation. When NIFTY rebounds, these leaders explode to new all-time highs.
Dual-Momentum Filter
To prevent buying relative strength in a falling bear market, Delta Theory enforces the Dual Momentum Rule: The stock must have positive Relative Strength (beating NIFTY) AND positive Absolute Momentum (trading above its 50 and 200 EMA).
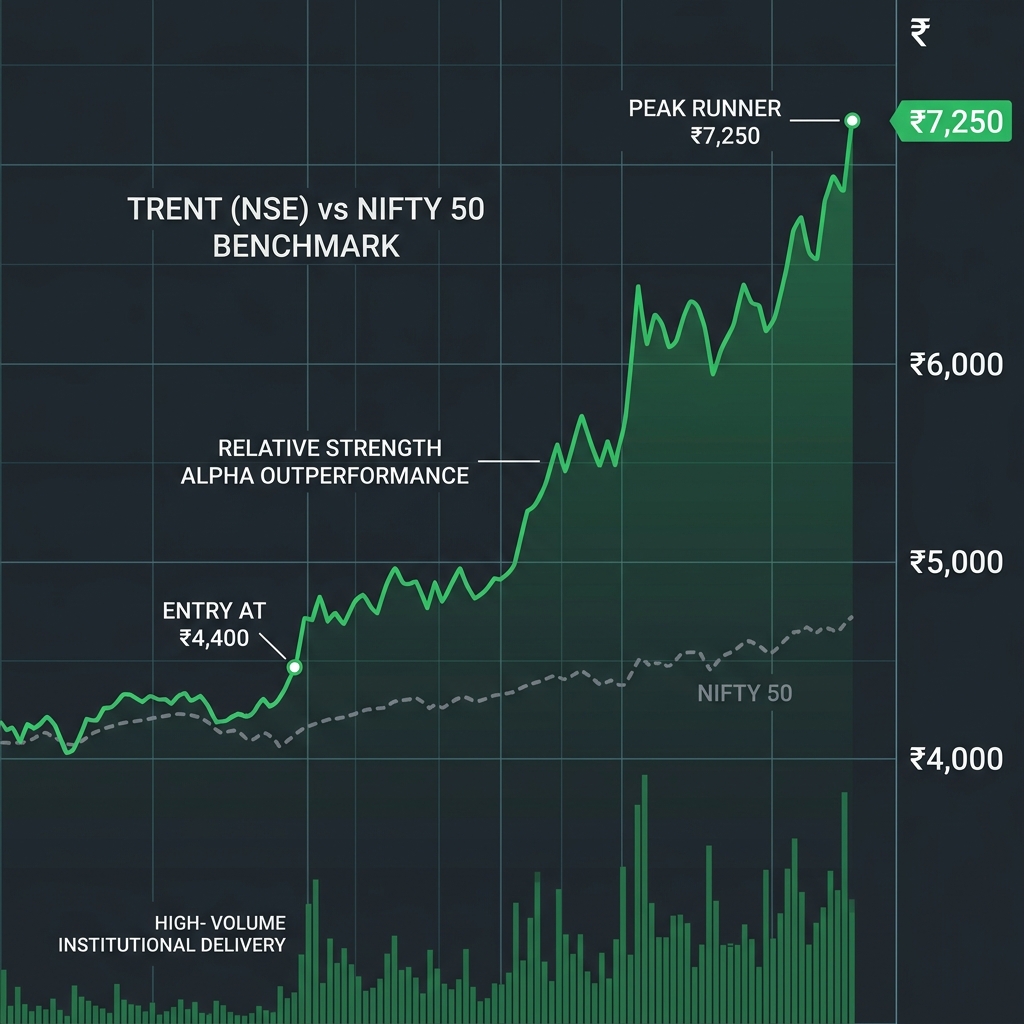
TRENT LTD vs NIFTY 50 Benchmark: Relative Strength Alpha Engine
Real-time comparative analysis demonstrating TRENT (NSE: TRENT) surging aggressively from ₹4,100 to ₹7,250 on massive institutional delivery volume while the NIFTY 50 benchmark moves at a modest pace.
The 4-Quadrant Relative Outperformance Matrix
Every weekend, our systematic screening algorithm plots all 500 stocks in the NIFTY 500 universe across four dynamic rotational quadrants.
Alpha Leaders
High RS Ratio & High RS Momentum. Stocks here are in strong structural uptrends and outperforming Nifty 50 consistently. This is where 80% of our portfolio capital is allocated (e.g. Trent, BEL, Dixon).
Maturing Leaders
High RS Ratio but Declining Momentum. The stock is still beating the index, but its rate-of-change is slowing down. Action: Tighten trailing stops to 20 EMA, trim 30% of position size.
The Value Traps
Low RS Ratio & Low Momentum. Stocks here are underperforming the market (e.g. beaten-down consumer or chemical stocks). Absolute zero capital allocation. Never average down here.
Early Stage Turnarounds
Low RS Ratio but Surging Momentum. Stocks rotating out of lagging into improving. We place these on our primary watchlist, preparing to enter the moment they cross into the Leading quadrant.
The Delta Quantitative Selection Rules
- Rank Universe: Filter only top 10% of NIFTY 500 stocks with highest 6-month Mansfield Relative Strength.
- Stage 2 Confirmation: Stock must be in a confirmed Stage 2 markup with 20 EMA > 50 EMA > 200 EMA.
- High 52-Week Closeness: The stock must be trading within 15% of its 52-week high. We never buy stocks trading near 52-week lows.
Volume-Weighted Delivery Analysis on NSE
Intraday volume in Indian stocks can be inflated by day traders and algorithmic market makers. The definitive signature of institutional accumulation (FIIs, Domestic Mutual Funds) is the Delivery Volume Percentage on the National Stock Exchange.
The >60% Delivery Surge Signature
When a stock breaks out to a new multi-month high, we pull the official NSE security-wise delivery report. If the delivery percentage is above 60% alongside 2× average volume, it proves institutions are taking delivery of real shares into demat accounts rather than intraday square-offs.
VWAP Slope & Institutional Anchors
We anchor Volume-Weighted Average Price (VWAP) from quarterly earnings days and major budget announcements. When price tests the quarterly anchored VWAP and holds firmly on rising delivery, it provides a high-probability low-risk swing entry point.
TRENT LTD: Real Multi-Bagger Blueprint
Step-by-step institutional case study showing how Delta Theory captured the historic move in TRENT LTD on NSE India.
Live Swing Execution: TRENT LTD (NSE: TRENT)
Delta Relative Strength Screen
While NIFTY 50 consolidated in a narrow range, TRENT registered an all-time high on its Relative Strength ratio line. It ranked in the top 1% of the entire NIFTY 500 universe.
Base Breakout at ₹4,400
TRENT broke out of a 6-week consolidation box closing at ₹4,400.00 on 68% NSE delivery volume. Initial stop-loss placed at ₹4,180.00 (5% risk). Initial buy executed.
Riding the 20-Day EMA
TRENT walked up its 20 EMA relentlessly for months. As the stock crossed ₹5,500.00 (+25%), we trailed the stop-loss to ₹5,100, locking in guaranteed risk-free profits.
Nifty Retail Leadership
Consumer and retail discretionary stocks showed high group momentum. TRENT acted as the locomotive leader, consistently outperforming peers like D-Mart and Shoppers Stop.
Peak Reached at ₹7,250
TRENT reached ₹7,250.00, delivering a staggering +64.7% capital return while the NIFTY 50 index gained only 7%. Delta Theory captured 9× the market alpha!
Exit on Trend Breakdown
When the stock finally closed below its 50 EMA with RS momentum dropping into Quadrant 2 (Weakening), our systematic exit trigger locked in the multi-lakh gain.
The Core Mantra of Delta Theory
Buy high to sell higher. Leave the bottom-fishing to retail traders and ride the verified institutional momentum leaders of the Indian economy.
Return to Academy Dashboard →