
Alpha Edge Advance Feature
An institutional TradingView dashboard built for Indian futures and options traders: continuously scanning CE & PE High/Low premium extremes, shortlisting qualifying contracts on the Buyer/Seller Filtration Board, and validating execution against the dynamic Trend Confirmation Line (TCL).
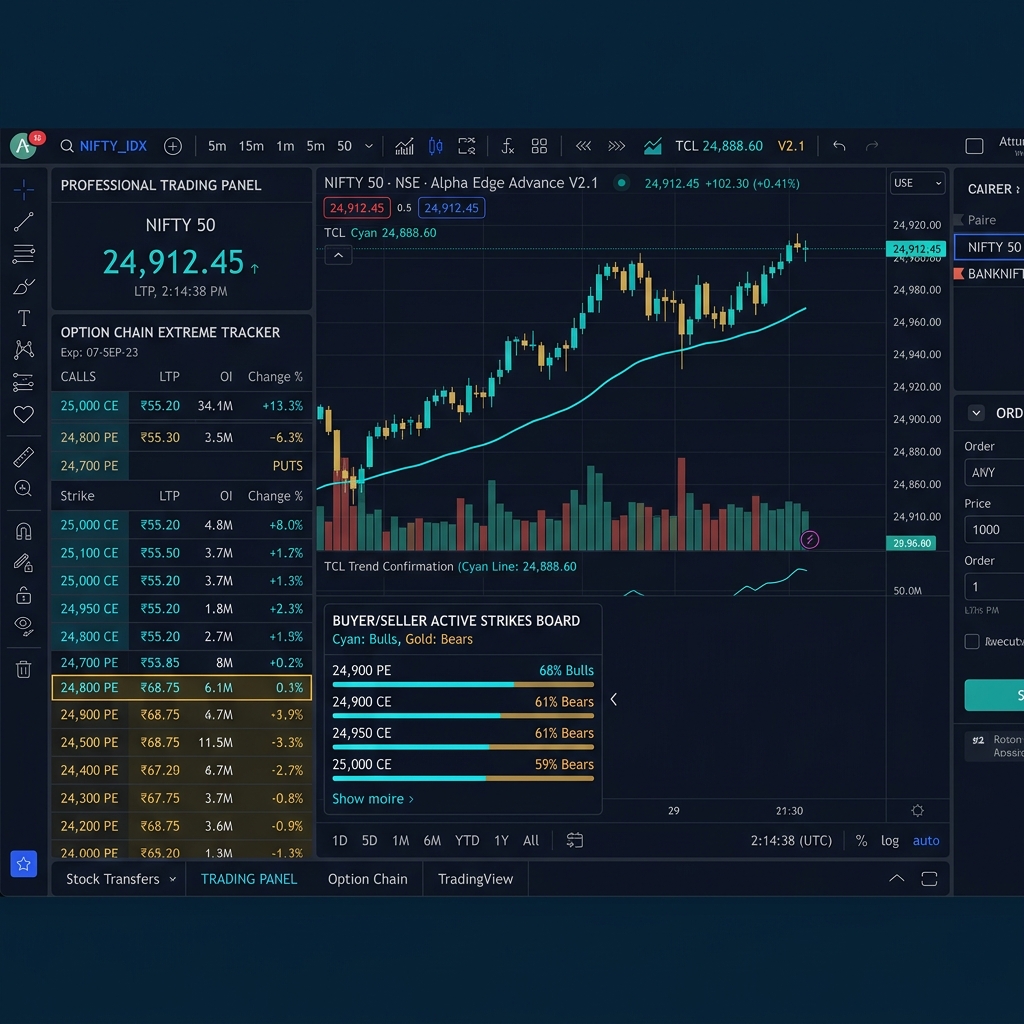
From Price Watching to Mathematical Strike Filtration
Retail traders get overwhelmed comparing 40+ strikes across call and put columns. The Alpha Edge Advance Feature V2.1 algorithm condenses market depth into four automated components running directly inside your TradingView layout.
Buyer / Seller Active Strikes Board
Instantly aggregates all shortlisted CE and PE contracts across your active index or stock. It checks whether the session low or high tested the institutional absorption zone and displays only actionable candidates.
CE & PE Session Extreme Tracker
Tracks the session Low and High for both call and put sides simultaneously. Compares Call Low against the O–P band (Optimal to Participation) and Put High against the U–O band, highlighting anomalies before spot breaks out.
Trend Confirmation Line (TCL)
A non-lagging, premium-weighted dynamic line plotted per option strike. If a call premium trades above TCL, the buyer setup is validated; if premium falls below TCL, the trade is automatically invalidated.
Dynamic ATM Reference Anchor
Continuously identifies the exact At-The-Money strike relative to live spot movement (e.g., NIFTY at ₹24,814.50 automatically marks 24,800 as ATM), preventing traders from mistakenly trading illiquid far-OTM strikes.
The Main Filtration Board Output
This is how the Advance Feature V2.1 terminal displays active strikes during live market hours on the National Stock Exchange of India.
ALPHAEDGEPRO | BUYER / SELLER ACTIVE STRIKES
INDEX: NIFTY 50 SPOT ₹24,814.50| SIGNAL | TYPE | STRIKE | LTP (₹) | OPEN (₹) | HIGH (₹) | LOW (₹) | TCL (₹) | STATUS |
|---|---|---|---|---|---|---|---|---|
| BUY | CE | 24800 | 215.40 | 142.00 | 228.00 | 138.50 | 194.20 | ACTIVE |
| BUY | CE | 24850 | 178.60 | 110.00 | 185.00 | 106.20 | 158.40 | ACTIVE |
| WATCH | PE | 24800 | 112.30 | 180.00 | 194.50 | 108.00 | 135.00 | RADAR |
| SELL | PE | 24750 | 88.50 | 150.00 | 158.00 | 84.20 | 118.80 | DECAY |
Five-Step Rule for Trade Execution
Never execute based on intuition. The Advance Feature enforces a strict sequential gate before taking any position.
Check Spot Index Trend
Identify whether NIFTY 50 / BANK NIFTY is sustaining above the day's median VWAP or rejecting key institutional levels.
Read U.O.P. Envelope
Confirm where option premiums sit relative to Participation (P), Optimal (O), and Universal (U) structural thresholds.
Check Low vs O–P Band
Verify that the contract's session low held inside the institutional accumulation band (between Optimal and Participation).
Inspect Filtration Board
The candidate contract must display green ACTIVE status on the board with Signal matching your index bias.
Confirm Above TCL
Enter only when option premium sustains above its dynamic TCL. Invalidation is fixed below TCL with predefined ₹ risk.
Scale into Targets
Lock profits at Side Up 1 (SU1) and trail stop-loss to breakeven, allowing runners to reach Main Target 1 (MT1).
Live Blueprint: NIFTY 24800 PE Strike Traversal
Review an institutional execution on the National Stock Exchange of India using the Advance Feature V2.1 dashboard.
NIFTY 24800 Put Option (Weekly)
At 10:15 AM, NIFTY spot index showed weakness below morning resistance. The Alpha Edge Advance Feature V2.1 flagged 24800 PE as ACTIVE on the filtration board.
The session low of ₹180.85 touched the Optimal band (₹179), absorbing institutional selling. As premium crossed above TCL (₹269.52), long positioning was initiated. Within 30 minutes, premium accelerated to ₹309.70 (+₹40.18 gain per lot).
Explore All 4 Proprietary TradingView Indicators
Our indicator ecosystem is designed to function together seamlessly across different timeframes and trading styles.